The last view years, while creating thousands of reports, clients always asked for relative metrics more than absolute values. The most common of them are daily, weekly, monthly unique visitors or visit. In the past there has been a native implemented metric from Adobe called „Daily Unique Visitors“ or „Monthly Unique Visitors“ (and more) which are not available in the newer report sources like Analysis Workspace. So the reason for this blog post is to explain how to calculate daily unique visitors to be used in Analysis Workspace (by Adobe).
The issue with the legacy metric
The question my client asked for was „how did the amount of daily unique visitors change in the last 4 weeks?“, a time period at the start of Corona times. I tried to get that out of Analysis Workspace by using the dimension „Day“ and the metric „Unique Visitors“ – no problem. Then he asked for the average of daily unique visitors in the two weeks prior to a certain date versus the average daily unique visitors in the two weeks after the same certain date.
The moment calculated metrics have helped
The moment I got stuck in Analysis Workspace because of missing the traditional „Daily Unique Visitors“-metric. So I started to try rebuilding this metric with the calculated metric builder and found a way to success and here is how:
This examples shows how to calculate daily unique visitors in a period of time (day), but it’s the same way to do for either another metric or time period.
How to create the calculated metric
- Start building a calculated metric in Adobe Analytics
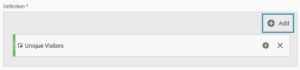
- Drag the metric „Unique Visitors“ in the definition field
- Add a formula (fx) using the „Add“ button
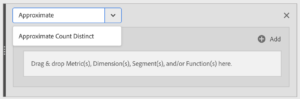
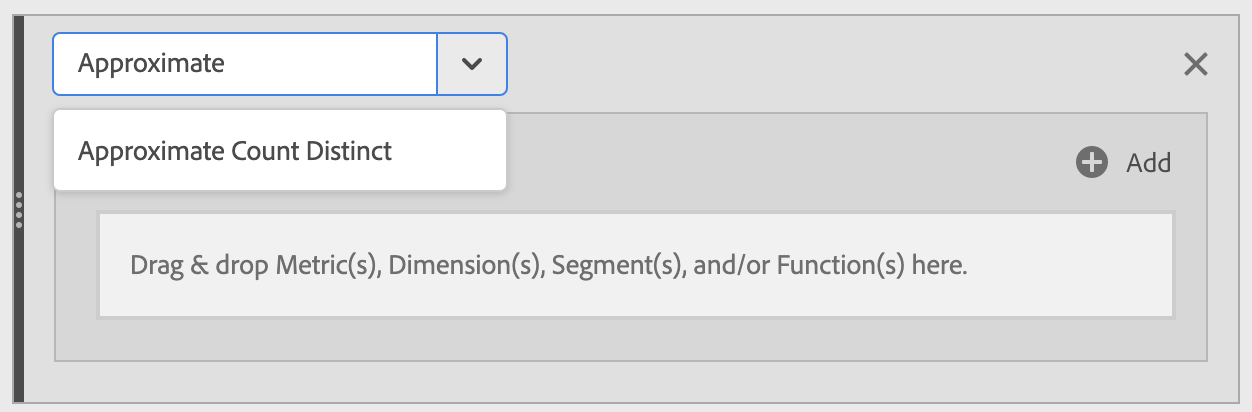
- Use formula „Approximate count distinct“
- Drop the dimension „Day“ into the formula so that you have this final definition:
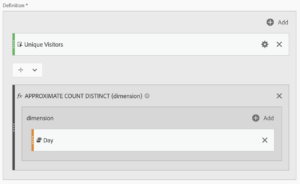
Nothing easier than that. After you have done this, the preview stats will show the daily unique visitors per day (nothing new), but if you use this metric in Analysis Workspace for any time period greater that a single day, it will automatically build an average.
Proof of the metric in Analysis Workspace
I’ve opened a new Analysis Workspace with a freeform table to outline the effect of our new metric.
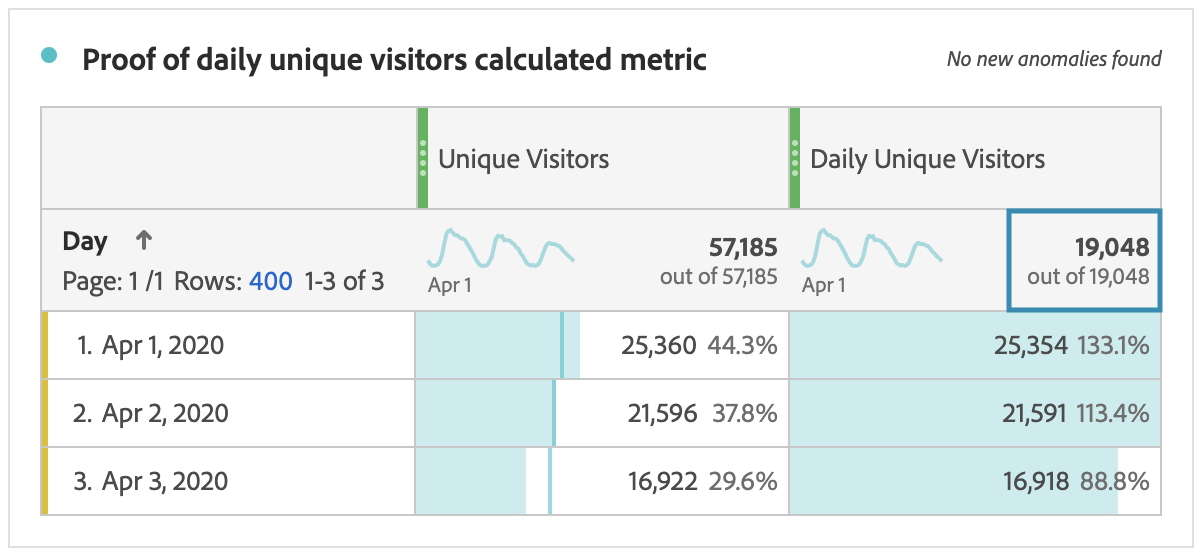
You might have recognized that there is a slightly difference for the values if you look at each separate day. This is because the approximated distinct count of dimension returns items for the selected dimension. The function uses the HyperLogLog (HLL) method of approximating distinct counts. It is configured to guarantee the value is within 5% of the actual value 95% of the time. That makes a count for one day not exactly 1.0. We need to deal with it.
What we really need is the fact, that the sum of the column shows an average of daily unique visitors for the appropriate time period which makes it usable for any other dimension you want.